The TL;DR of all this: A reminder that the people who take surveys and the people who vote are not always the same mix, and the gap between those two groups can move the numbers a few points either way. Also, all surveys aren’t equal.
Mark Harris at ColdSpark shared a chart recently from internal tracking in a few Pennsylvania State Senate districts. Across 892 interviews, the people who vote in every general election and are registered Democrats showed up at about 129% of the quota the voter file said they should. That’s 257 of them when the target was closer to 112. Four-of-four Republicans were essentially on target. A lot of the lower-propensity Republicans were short.
I do think we're looking at a polling error right. Last night there were 892 interviews across a bunch of districts. 4/4 Dems were +129% of expectations, 4/4 Republicans only +2%. pic.twitter.com/8WgiC7flNU
— Mark Davin Harris (@markdharris) October 13, 2026
It’s the kind of thing that happens when response rates are low. Voters who always show up also tend to be the ones more willing to participate in a survey. When those always-voters lean heavily one way, they can fill a quota fast and leave less room for everyone else. Classic non-response bias.
Non-response bias happens when the people who answer a survey differ systematically from the people who don’t. The sample ends up skewed because of who chooses to participate.
Mark notes that 4-of-4 Democrats are close to a 99-to-1 group; meaning out of 100, 99 of them are likely to self report as Democrats. Lower-propensity Democrats are less uniformly partisan. The difference between those two cells can move a number a few points if the high-propensity ones take up more, or in some cases a large majority of the sample than they will make up of the actual electorate on Election Day.
Mark’s example here is a good anchor reference
A cell of 4/4 Democrats is roughly 99-1, while a lower-propensity Democratic cell is closer to 85-15 (a 14-point difference). He adds that if that kind of difference applies to 40% of a group, it produces a ~5.6-point swing on the ballot— a point I’ve shared with multiple folks recently.
This isn’t unique to Pennsylvania; we’re seeing this in surveys in Alabama, Oklahoma, North Carolina, South Carolina, Tennessee, and more. It is worth keeping in mind when looking at surveys in general, but certainly where Republicans have been underperforming relative to what registration (in the states that have it) and past presidential numbers might show.
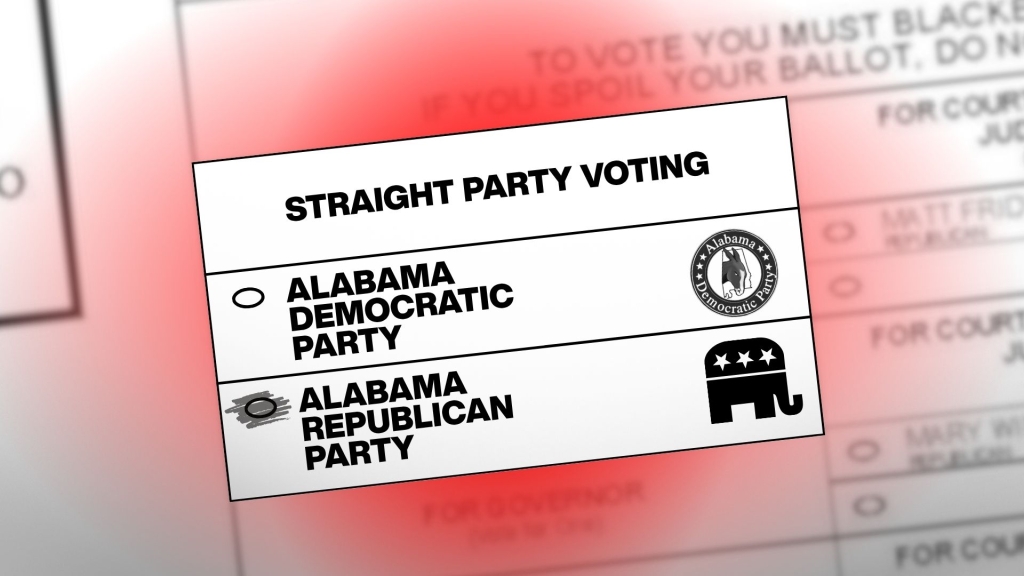
One open state Senate seat in Alabama that covers parts of Madison and Limestone, 2024 showed a result of +1.5 points for Trump in 2024 after an 11-point Republican margin two years earlier (Presidential v. Midterm). Yellowhammer News pointed out earlier this week that among voters who have participated in at least two of the last four generals, the lean-Democratic numbers in that district outpace the lean-Republican ones. In the May primary, more people in Madison County chose a Democratic ballot than Republican for the first time in a long time.
These are things that have to be considered in a survey’s sample as well.
Some of that movement is absolutely real and not entirely attributable to a non-response bias. Huntsville, Madison, and the surrounding communities have grown. Defense and tech jobs have brought in people from other parts of the country. Housing costs and issues that are normally relegated to local-level races are showing up in state-level races that used to be pretty far down the list on the top issues question.
The question is
How much of the current picture being seen in polling here in Alabama is being amplified by the same response patterns Mark is seeing in a totally different state like Pennsylvania, versus genuine demographic and cultural shifts?
High-propensity voters are more likely to be the ones answering phones or filling out surveys. If, in this case, those are high-propensity Democrats, and they are being over-represented in samples the same way they seem to be in Pennsylvania, the surveys can make Republican underperformance appear larger than it will actually be once lower-propensity voters show up on Election Day.
If they show up.
The opposite can also happen, though. If the lower-propensity Republicans who have been harder to reach as of late stay home, the surveys will look more accurate, post Election Day.
I’ll be the first to say, Alabama is not Pennsylvania. Statewide the Republican floor is pretty high. Most of the legislative seats Yellowhammer flagged are still uphill battles for Democrats even with the local shifts. But the issue Mark describes in his post above is one we are seeing frequently in our own surveys as well.
When the easiest people to interview for a survey are the ones who vote every cycle and lean heavily Democratic, the sample will tilt that way before anyone weights it. Weighting by party and demographics helps, yes, but it does not always catch differences in intensity inside those groups.
None of this means the movement in North Alabama, or any of Alabama’s other most populated areas is imaginary. District lines have changed, populations have changed, and some of these races are going to be closer for structural reasons. But it does mean that when a poll shows Republicans lagging behind past-turnout numbers or models would imply, it might be worth asking how the vote-history cells are being filled.
Dalton Dismukes is the founder and President of Strategy Management, a political and public affairs consulting firm based in Montgomery, AL. Follow him on X at @SM_Wins and @DaltonDismukes. This column first appeared on his Substack.