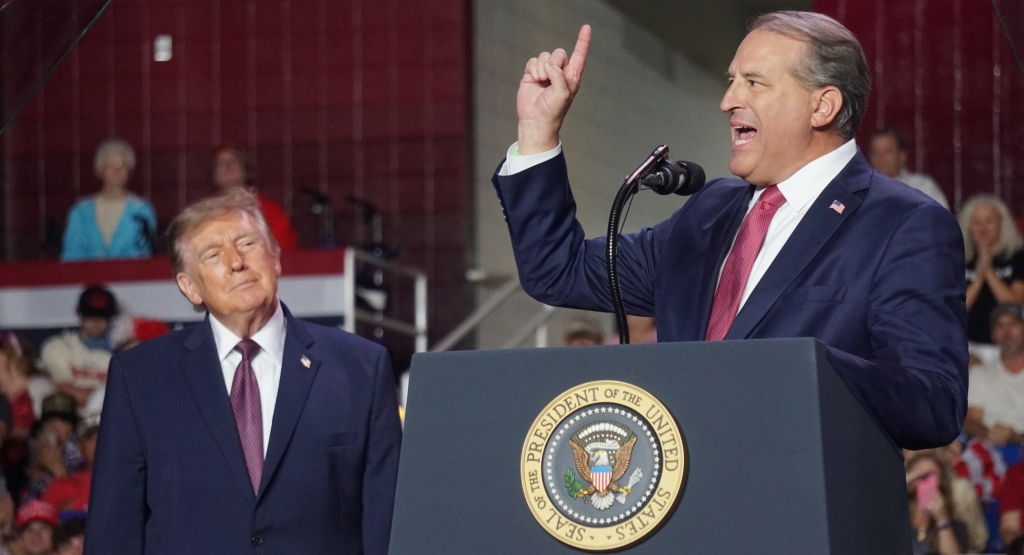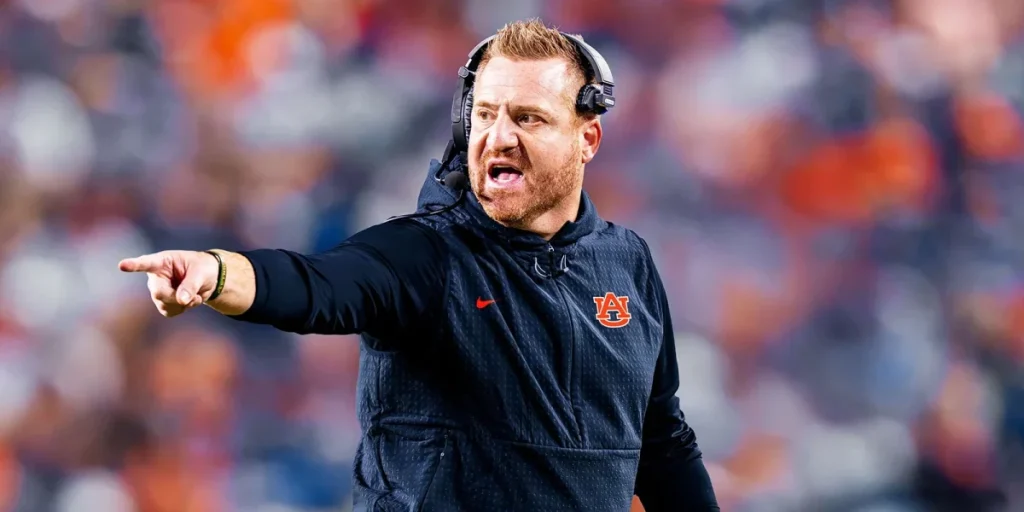
U.S. Senator Tommy Tuberville (R-Auburn) won the governor’s race Tuesday by 66,308 votes, 51.8% to 47.9%, according to unofficial returns from the Secretary of State.
It was Alabama’s closest governor’s race since 2002, when Bob Riley beat Don Siegelman by 3,120 votes.
RELATED: Did Alabama Republicans maintain their supermajorities in the Legislature?
Governor Kay Ivey won by 19 points in 2018. Tuberville’s margin was about 15 points smaller. The rest of the Republican ticket slipped too, just not as far.
Compared with 2018, the Republican margin shrank 14 points for lieutenant governor, 13 for secretary of state, 10 for auditor and 8 for attorney general.
Every statewide Republican below Tuberville won by 8 to 10.5 points.
Doug Jones finished with 806,253 votes, 132,901 more than he received winning the 2017 Senate special and the most any Democrat has received in an Alabama midterm.
Statewide, 1,693,621 people voted, within 26,000 of 2018. The total barely moved. The counties behind it did.
In 13 counties, more people voted than in 2018. Those 13 gave Ivey a 131,350-vote margin four years ago and gave Tuberville 21,725.
In the 23 counties where turnout fell 10% or more, the Republican margin dropped by an average of 6 points. In the counties where turnout rose, it dropped by 16.
Where Democrats gained
Madison. Ivey won it by 7 points in 2018. Jones won it by 16. Turnout rose 13%, and Jones received 27,075 more votes than Walt Maddox did. The county cast 159,340 votes for governor, the most in the state, and voted out the sheriff, two state senators and a state representative on the same ballot.
Limestone. Turnout rose 18%, more than in any other county. Jones received about 6,400 more votes than Maddox. Tuberville finished 380 votes behind Ivey. A 38-point Republican margin became 15.
Shelby. Ivey won it by 36 points, Tuberville by 13. Jones added about 10,600 votes to Maddox’s total, and Tuberville came in about 8,400 short of Ivey.
Montgomery. Jones won by 50 points, almost double Maddox’s margin, and beat his own 2017 margin by 4. The county cast 80,303 ballots, up from 58,133 in 2022.
Autauga. The Republican margin went from 42 points to 21, nearly the same as Jones’ 2017 result there.
St. Clair. Still 39 points Republican, down from 57. Jones ran 3.5 points better than he did in 2017.
Lee. The margin shrank from 19 points to 3, and Tuberville held it by about 1,750 votes. Jones carried Lee by 17 in 2017, so Auburn’s former coach outran the 2017 map in his home county by 20 points.
Jefferson. Jones won it by 90,312 votes. Maddox won it by 46,442 in 2018 and Jones by 83,409 in 2017. He did it with turnout down 4% from 2018.
Those eight counties account for 89,312 of Jones’ 111,758-vote gain over Maddox. The other 59 counties combined added 22,446.
Where Republicans held
The margin moved toward Republicans in only five counties.
Fayette. Tuberville received 77.7%, up from Ivey’s 72.8%. No county moved further right.
Marion. Tuberville received 81.7%, compared with Ivey’s 80.9%.
Clay. Tuberville received 77.2%, compared with Ivey’s 76.9%.
Washington. Tuberville received 68.6%, compared with Ivey’s 68.5%.
Hale. The one Black Belt county on the list. Jones won it by 27 points; Maddox won it by 28.
Lawrence, Lamar and Walker held within 4 points of 2018. Next door to Lawrence, Morgan County moved 18 points toward Jones.
Baldwin. It moved about 8.5 points toward Jones. It was also the only county in Alabama where Tuberville received more votes than Ivey did, and his 33,305-vote margin there was his largest anywhere.
Fewer people voted in nearly all of the counties that held. Turnout fell 21% in Fayette, 19% in Walker, 18% in Sumter and 16% to 17% in Clay, Lamar, Lawrence and Marion. Statewide, it fell 2%.
The longer view
The three-county Huntsville metro of Madison, Limestone and Morgan gave Ivey 69% in 2022 and Tuberville 47.8% on Tuesday. The last Republican to do that poorly there was Roy Moore, at 48% in 2017. The region cast 235,743 votes for governor, more than Jefferson County, and it has grown 42% since the Moore race.
Jefferson County went from 49% Republican in the 2010 governor’s race to 31.7% on Tuesday. The Birmingham suburbs of Shelby, St. Clair and Blount went from 82% in 2022 to 62.7%. Mobile and Baldwin, taken together, went from 71% to 55%.
The 34 rural counties outside the metros, the Black Belt and the Wiregrass gave Tuberville 67.4%, down from 83% for Ivey in 2022 and about even with where they were in 2016. The Black Belt gave Jones 59,224 votes, 2,290 more than it gave him in 2017.
Jones’ biggest gains came in Huntsville, the Birmingham and Montgomery suburbs and Auburn. Tuberville held on with Baldwin and the rural counties, most of them with lower turnout than in 2018.
Republicans cast 645,002 straight-party tickets Tuesday, about the same as the 648,953 they cast in 2022. Democrats cast 549,433, up from 298,434. The Republican base voted at the same rate it did four years ago. The Democrat base grew by a quarter-million straight tickets in four years, nearly all of it in the counties where Tuesday’s turnout rose.
That was enough for Tuberville this year. Whether it is enough in 2028 depends on those suburbs, and on whether the rural counties that stayed home Tuesday come back.
Grayson Everett is the editor in chief of Yellowhammer News. You can follow him on X @Grayson270.